Getting Started
Create Account
To get started, upload your own drawings or try a demo project.
Account Home
Account Home is where you upload, organize, and open your projects. Here's where everything lives.
Uploading Drawings
- Click the Create Project card (“Click to upload project”) to upload a PDF. A progress bar appears while it processes — keep the window open.
- Or drag a PDF directly onto the + (Create Project) card to upload it.
Top Bar
- Search — the box in the center filters your projects by name as you type.
- Grid / List toggle — the small icon button at the right edge of the search box switches between thumbnail grid and list view.
- Customization (gear) — opens AI prompts, controls, and color settings (see the Customization section below). Requires a subscription.
- Revisions (compare icon) — turns on Revisions mode to compare a drawing set against an original (see Revisions).
- Learn (graduation cap) — opens this page.
- More (chevron) — hidden menu with Duplicate and Delete bulk modes.
- Account menu (avatar, top-right) — Company analytics and Log out.
Folders & Organizing
- Folder sidebar (left) — click a folder to filter the grid. “Shared with me” and “Unassigned” are built in.
- New folder — the button at the bottom of the sidebar creates a folder and lets you rename it right away.
- Folder settings (gear, on hover) — rename and invite teammates with Viewer / Editor / Owner roles. Leave folder appears on shared folders.
- Drag and drop — drag a project onto a folder to move it, and drag folders or projects to reorder them.
Takeoff Workspace
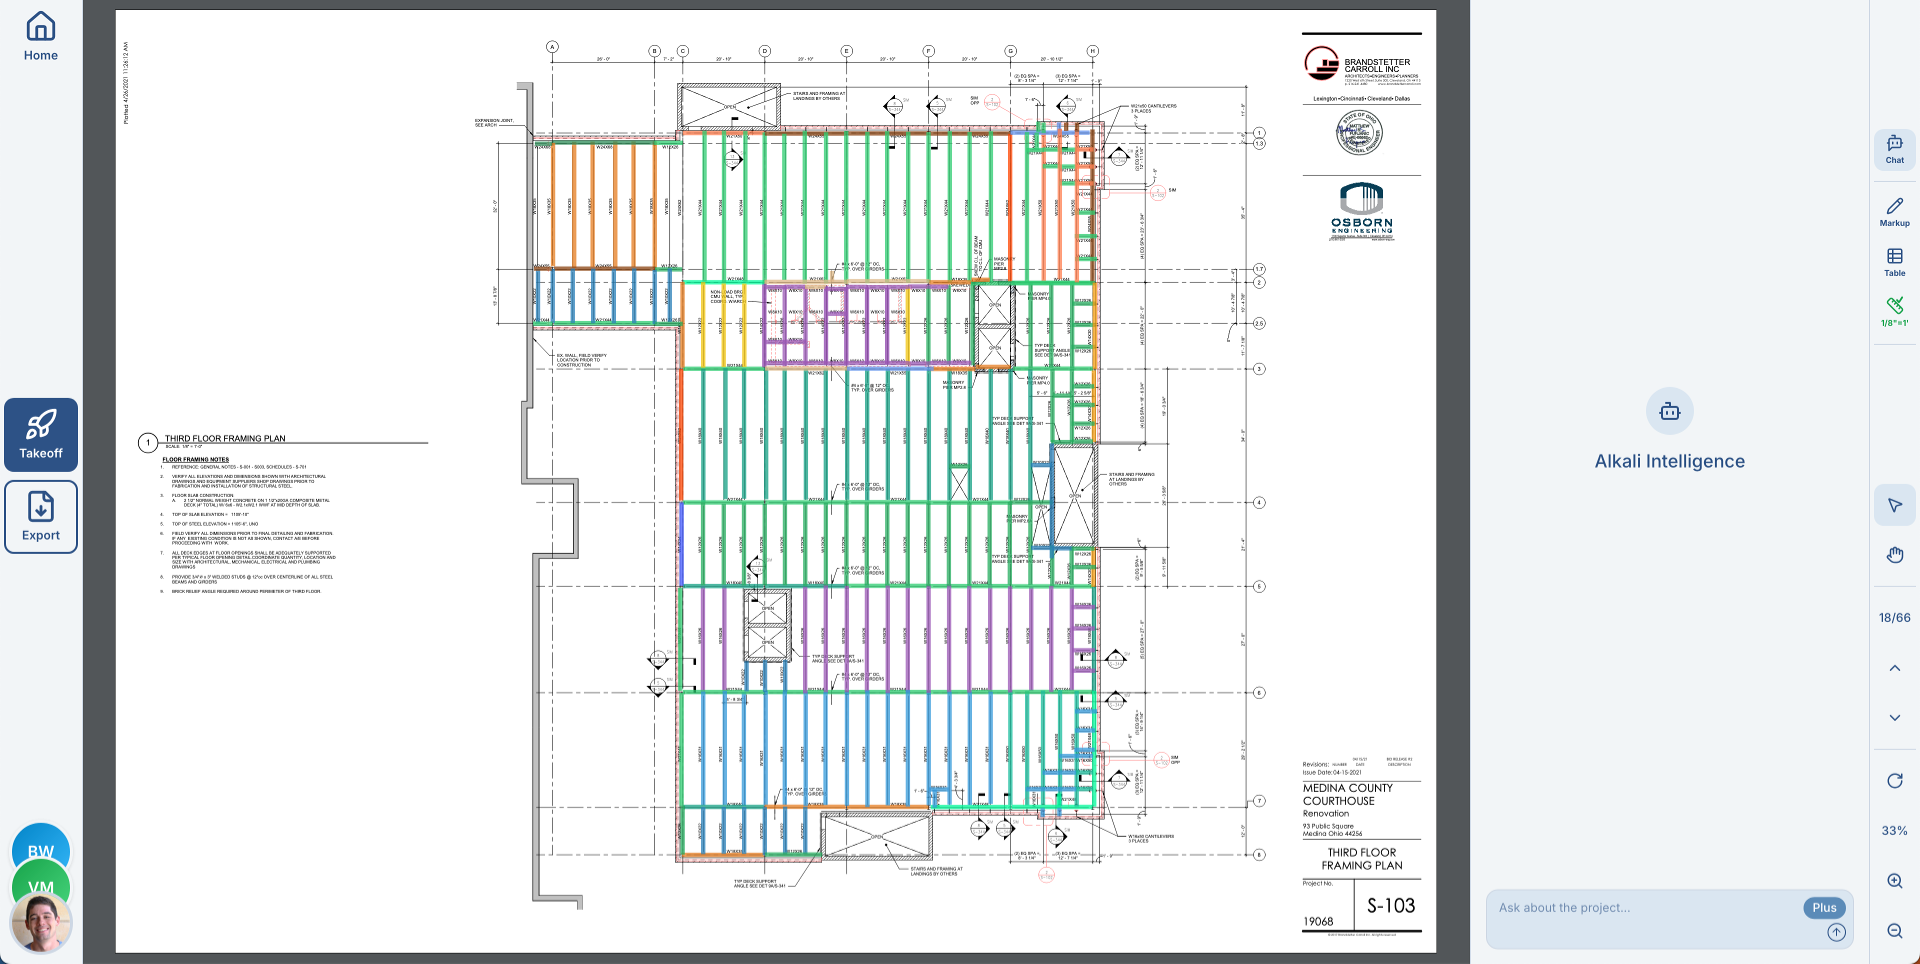
- Navigate back to your projects
- Open Automated Takeoff Menu. Detect beams, braces, columns, and base plates
- Open Export Menu. CSV material list, marked up PDF, 3D model, nesting
- JDSMAKUsers viewing project
- Open Chat. Ask questions about your drawings
- Open Markup Tools. Manually annotate beams, columns, plates, and panels
- Open Markup Table. View and edit all annotations
- Open Scale Calibration. Set the drawing scale for accurate measurements. See the tutorial here.
- Select and Pan tools*
- 3/12Page navigation*
- 25%Rotate and zoom controls*
*Moved to a bottom-of-page bar in Bluebeam Mode
Core Features
Automated Takeoff
Advanced computer vision algorithms, developed in-house, are available to significantly speed up the takeoff process.
Start Takeoff
Scan for:
Scope:
Select what to scan for, choose the scope, and press Continue.
- Beams — Detects horizontal steel members on framing plans, including details like camber, welded studs, copes, and connection codes when shown
- Joists — Identifies open-web steel joists and joist designations
- Bracing — Identifies diagonal bracing members
- Columns — Finds location, height, and section size (W, HSS, pipe)
- Base Plates — Finds dimensions, material, and fastener details (type, grade, count, diameter)
Follow the automated markup live in the Chat sidebar!
Limitations
Always review AI-generated annotations for accuracy. Hand-drawn sketches, poor scan quality, or unusual callout formatting may reduce detection accuracy.
Exports
Export your completed takeoff to Excel, PDF, or as a 3D model.
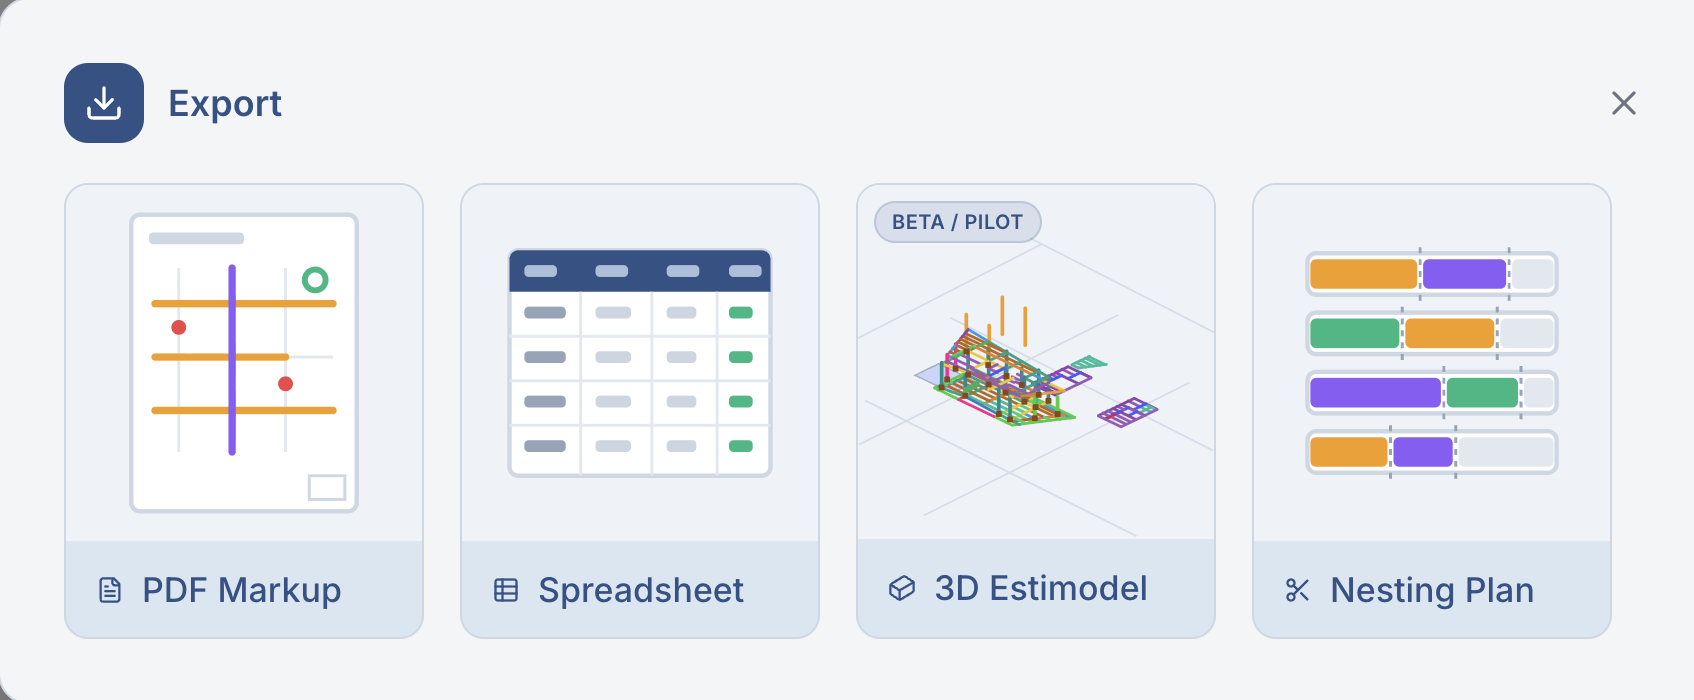
- Spreadsheet (CSV) — Exports to CSV exactly the information currently visible in the Markup Table, such as Length, Weight, etc. Be sure the Markup Table reflects what you want to export. Excel compatible, Tekla PowerFab compatible.
- PDF Markup — Download PDF with all markup included (Bluebeam compatible)
- 3D Estimodel — 3D model of your takeoff. Can be exported as IFC.
- Nesting Plan — Produce and export a nesting plan for linear members.
Chat
An AI with full visibility to PDF images and metadata.
How to Use
- Open the chat panel from the toolbar
- Type a question about the project you're working on
- Alkali analyzes the project and provides support
Note: The Chat sidebar is also where you'll see live progress when running Automated Takeoff scans for beams, columns, and base plates.
Image Understanding
Send image snapshots to Alkali Intelligence to help understand details, clarify callouts, and answer questions about specific regions of the drawing.
Click the icon, and click and drag over the region of interest. It will be automatically added to the chat.
Find and Understand Details
Even in huge bid sets, Alkali Intelligence can help find and understand the relevant details to build out your estimate.
If you ask Alkali to find and crop specific features, it will show them to you. Click the button, and it will highlight the region of interest.
Examples
- Search: Identify key elements in long (100+ page), dense PDFs
- ⤷"Find all structural and miscellaneous steel in this bid proposal."
- Search: Locating framing details across multiple pages
- ⤷"What is the height of the beam supporting the canopy?"
- Extract: Exporting tables
- ⤷"Export the column schedule to Excel."
- Understand: Multimodal image questions
- ⤷"What is this dotted line on the tilt-up wall signify?"
Markup Tools
Markup Tools let you manually annotate your drawings and manage the material catalog for your project.
Material Catalog
The Material Catalog is your project's material library with 1000+ types from the AISC Steel Construction Manual.
- Beams — Horizontal members represented as a line
- Columns — Vertical members represented as a filled circle
- Plates — Base plates, connection plates, represented as a lego block
- Panels — Metal deck and grating, represented as a rectangle
Usually Alkali will automatically find and add known members to your quick-selects. To add other known members, search for the member type, and add it.
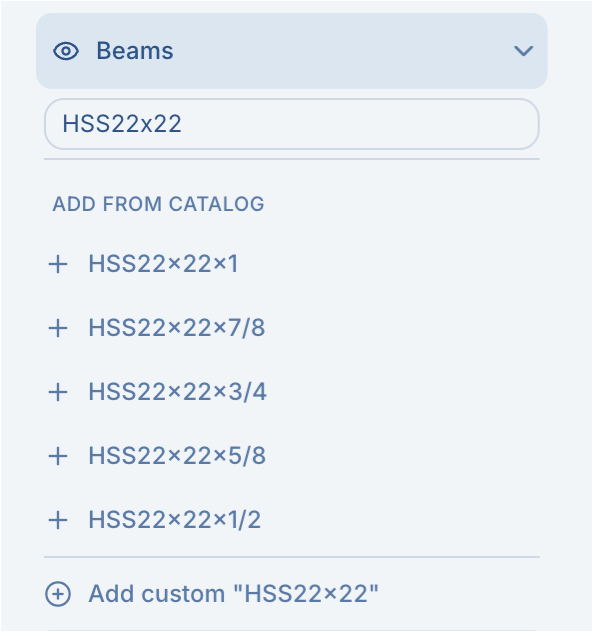
You can also add a custom item when a member isn't in the catalog — give it a name and your own properties (including a custom lb/ft).
Adding a custom item.
Most other items can be represented using beams and plates:
- Bent plate — found under Plates by setting the plate type to Linear.
- Bollards or other items can be added as plate annotations — just override the weight (or set it to zero).
- Specialty members, flat bars, or railing — represent as beams with a custom lb/ft (or none at all).
Defaults
- Point Tool — Place precise points on your drawing
- Line Tool — Draw straight lines for connections or dimensions
- Polyline — Measure complex contours and multi-segment shapes
- Polyarea — Measure areas with multi-segment boundaries
- Cloud Tool — Call out areas needing attention
- Notes — Add text notes anywhere on the drawing
Right Click Menu
After selecting multiple beams or markups, right click one of the selected objects to open a quick action menu. This is useful for cleaning up scans and keeping repeated members consistent.
- Align — Line up selected objects by their left, center, right, top, middle, or bottom edge.
- Distribute — Evenly space three or more selected objects horizontally or vertically.
- Make same length — Apply the right-clicked beam's length to the other selected beams.
- Make same shape — Apply the right-clicked beam's member type to the other selected beams.
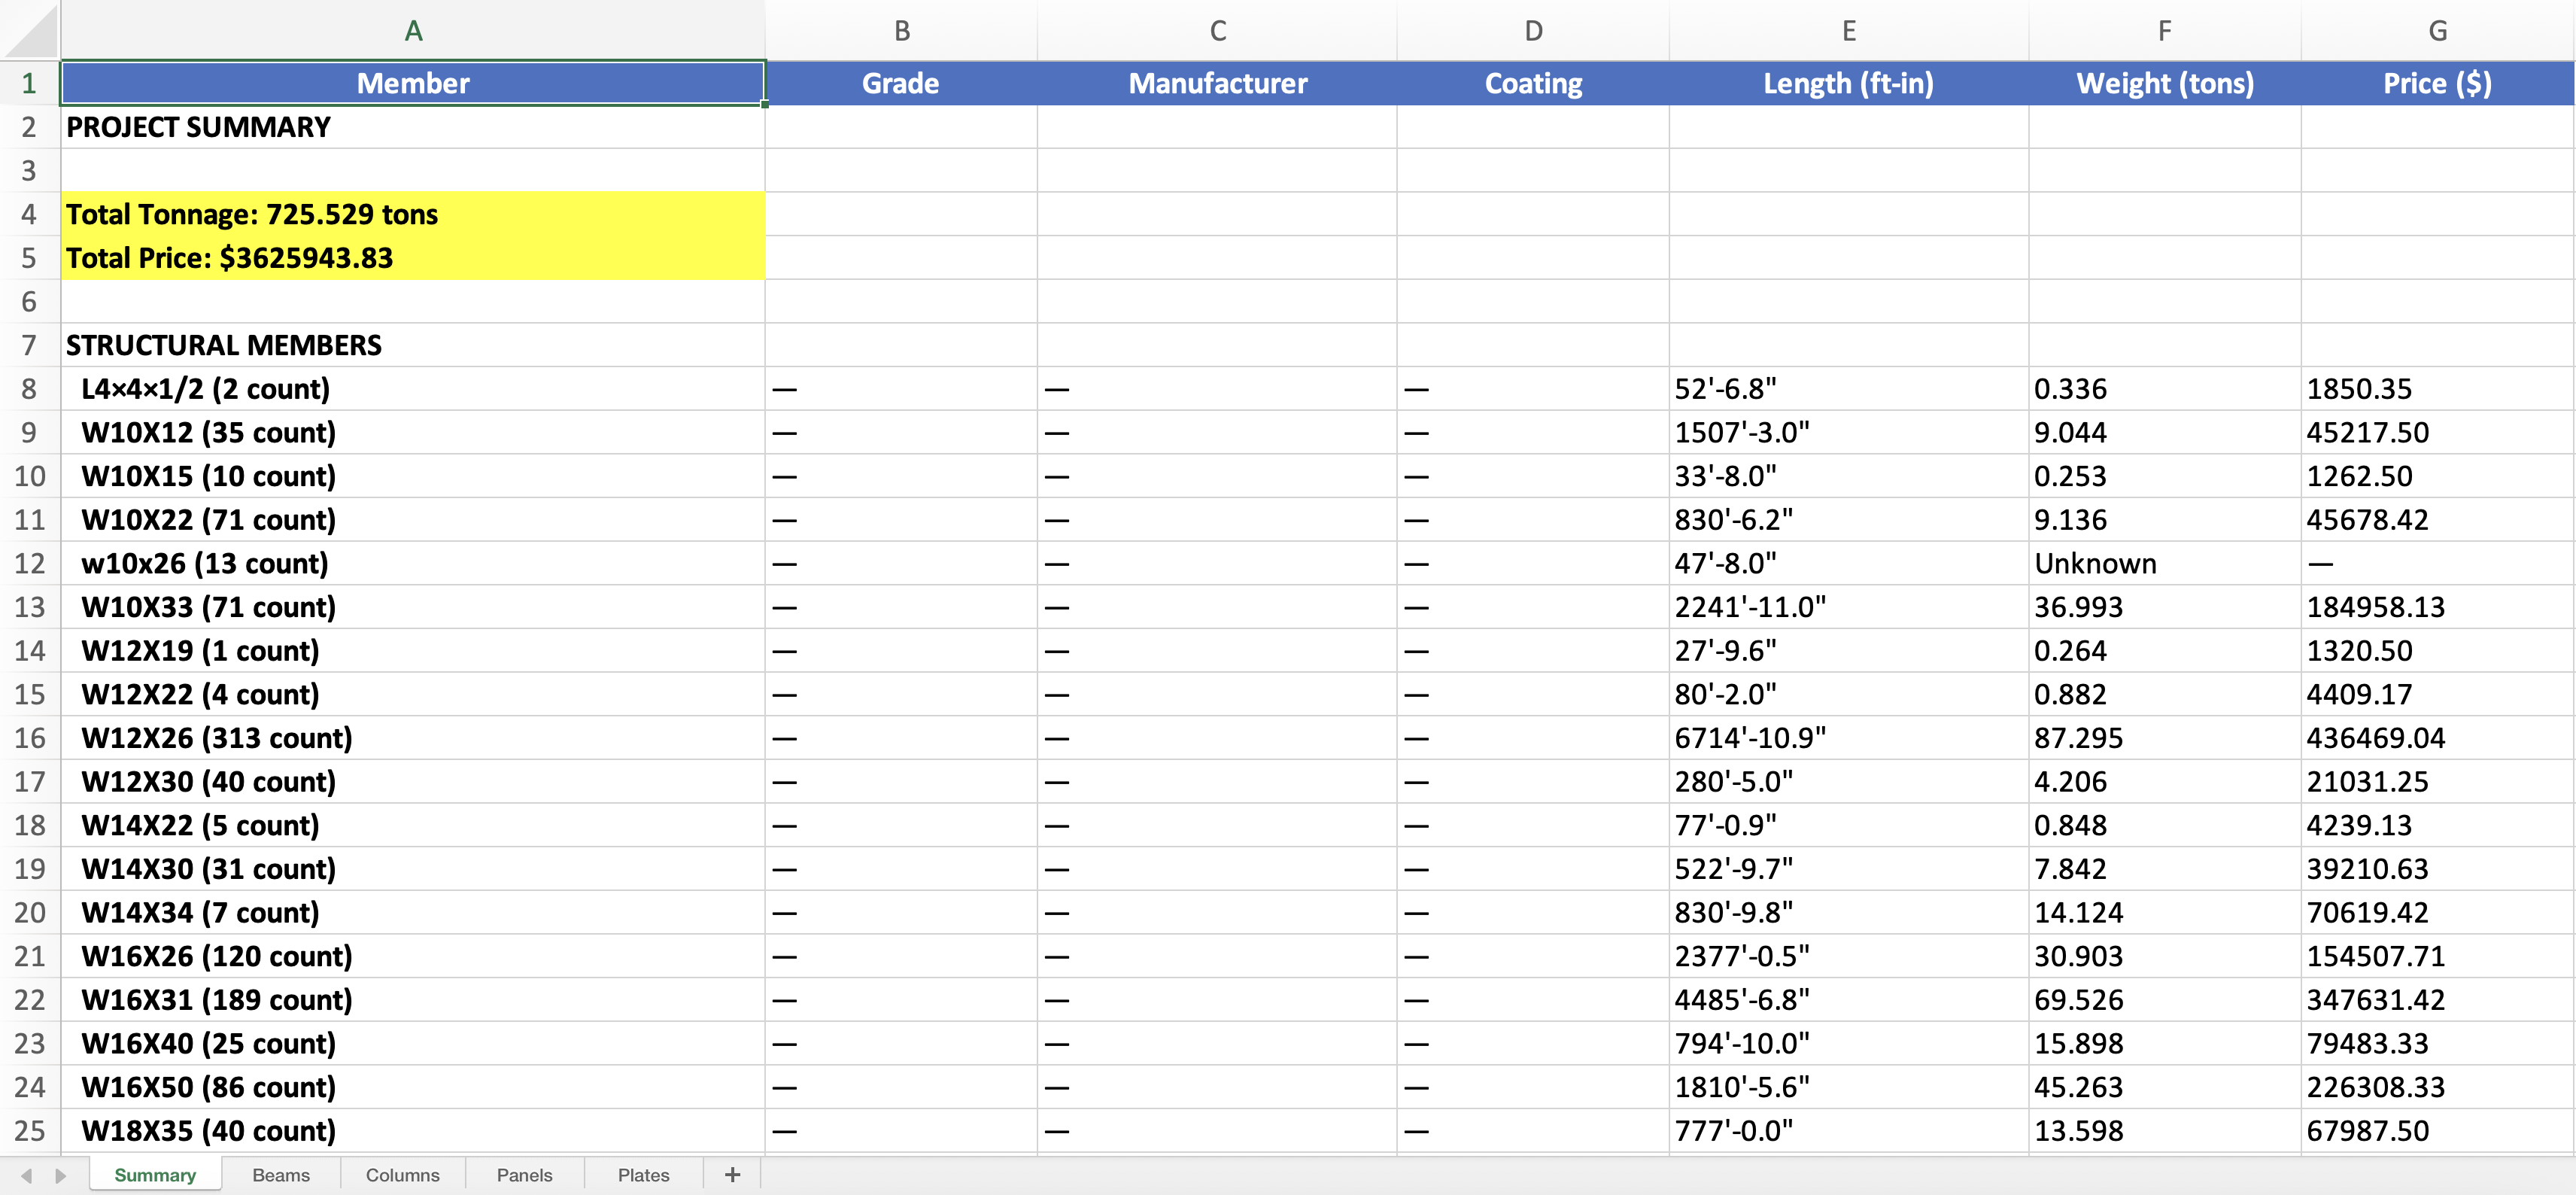
Markup Table
The Markup Table is the live table view of your project markup. Use it to customize columns, edit multiple rows at once, and move quickly between the PDF and your estimate data.
The Markup Table is shared at the project level, so if multiple people are estimating together, they're all working from the same live table view of the project markup.
Opening the Table
Click the Table button on the right sidebar to open the Markup Table. The controls along the top of the table are:
- Filter — type to filter rows; type page 3 to show only that page
- Row Visibility — summarize the table or hide categories of markup
- Column Visibility — show, hide, reorder, and add columns
- Pop Out — open the table in its own window (use the icon to dock it back in)
Columns & Customization
Each row represents a markup object with its associated data. Click the Column Visibility button to show, hide, and customize the columns that matter for your estimate. You can also add new columns for project-specific metadata. To add a column, open Column Visibility and check the box next to the columns you want. Unique, project-specific fields can be added at the bottom under Custom Properties. Some key columns include:
- Mark — Unique identifier for each annotation
- Name — Material type from your catalog
- Page — Which drawing page the annotation is on
- Length — Calculated length in feet and inches
- Weight — Calculated weight in pounds, taking the material weight from the AISC handbook
- Grade, Mfr, Coating, Camber — Additional material properties
- Custom Columns — Add and tailor fields for the way your team estimates
Sorting
Sort the table by fields like Mark, Type, Page, Length, or Weight to review related rows together.
Row Visibility
Open Row Visibility (the button) to control which rows appear in the table. Each toggle shows or hides that category:
- General Markup — points, lines, clouds, and notes that aren't tied to a catalog member
- Beams, Columns, Plates, Panels — show or hide the rows for each member category
- Fasteners & Connections — show or hide fastener and connection detail rows (when present)
- Group Identical Rows — collapse matching members into a single summarized row to roll up the table
Bulk Edit
- Highlight the range of cells you want to update.
- Control double-click the cell in the column you want to fill.
- Enter the contents you want to apply.
- Press Enter and Alkali will propagate the value through the selected cells in that column.
Linked to the PDF
- Click a row — Highlights the annotation on the PDF and scrolls it into view
- Click an object on the PDF — Jumps to the linked row in the Markup Table
Pop Out & Side-by-Side Review
Pop the Markup Table out into its own window when you want to review the PDF and table side by side. This makes it easier to audit takeoff data, compare rows against the drawing, and work through larger estimate reviews. Use the icon at the top-right of the table to pop it out, and the icon to bring it back.
Live Estimate Data
The table updates as your markup changes, so quantities, weights, and metadata stay in sync while you work.
Customization
Tailor Alkali to the way you work. Open Customization from the button in the top-right of Account Home, or inside a project by clicking your user avatar at the bottom-left and choosing Customization. It has four tabs. (Requires an active subscription.)
AI Prompts
Build a library of reusable Chat prompts. Save a prompt, activate one to use it in Chat, and set a default so it's ready on every project.
Keyboard & User Controls
Toggle between Alkali Default controls and Bluebeam-inspired controls for navigating your projects.
Connection Details
Configure the connection schedule used for your takeoff, and rerun it across all pages when you change it.
Color Controls
Toggle between Alkali Default and Annotation Coloring.
- Alkali Default — Markup is colored automatically based on each member's steel shape.
- Annotation Coloring — Every annotation starts from one default color you pick; any annotation can then be recolored individually or by mass-selection.
Scale Calibration
The length scale for each page needs to be calibrated for accurate measurements. Each page stores one scale that applies to all measurements on that page. Alkali offers two calibration methods to fit different drawing scenarios.
Method 1: Line-Based Calibration
Use this method when you have a dimension marked on the drawing (e.g., a wall labeled "30'-0""):
- Select the Line tool
- Draw a line along the known dimension
- Click the Ruler button in the right sidebar
- Enter the actual length in feet and inches
The system calculates the pixel-to-foot ratio and applies it to all measurements on that page.
Method 2: Scale-Based Calibration
Use this method when you have the drawing scale notation (e.g., "1/4" = 1'-0"" in the title block):
- Click the Ruler button without selecting a line
- Enter the scale equivalency (inches on paper = feet in real world)
- Or use quick presets for common scales (1/8", 1/4", 1/2", etc.)
The pop-up shows your current calibration and the page's PDF dimensions to help verify the scale.
Tip
Calibration is stored per page. If your drawing set has multiple scales, calibrate each page individually. The ruler icon changes color to indicate calibration status: orange means not calibrated, green means calibrated.
Scale Zones
Use scale zones when one sheet has multiple drawing scales, enlarged details, sections, or sloped roof/framing areas. A scale zone is a drawn region on the page with its own scale settings, so measurements inside that boundary use the zone's calibration instead of the page default.
- Open the Scale Zones tab from the calibration modal.
- Click Add a scale zone, name the zone, and click Draw.
- Draw a boundary around the region that uses a different scale.
- Use the zone tab to enter the scale. Toggle roof pitch on when the area is sloped, then enter pitch and slope direction.
- Measurements inside the zone use that zone's scale; measurements outside use the page scale.
Nesting
Optimize how cut lengths are nested onto stock bars to minimize waste. Upload or pull cuts directly from your takeoff, compare scenarios with different stock and pricing, and export cut lists to PDF.
Getting Cuts Into the Optimizer
There are two ways to load cuts:
- From a project — Navigate to Export then Nesting Plan. Cut lengths are pulled automatically from your takeoff annotations, grouped by beam type and material.
- Upload a file — Navigate to www.alkali.engineering/nesting and drag-and-drop a CSV or Excel file with columns for Beam Type, Cut Length, Quantity, and optionally Material.
Nesting Interface
Once cuts are loaded, each beam type appears as a collapsible row. The header shows the beam type name, the number of unique cuts, and the total piece count. Click a row to expand it and see:
- Kerf & Trim — The current kerf width and end-trim for this beam type.
- Stock — Click to expand a table of available stock lengths with their limit and $/ft. These values come from the stock config (see below).
- Cut table — Every cut length and its quantity.
- Errors / Warnings — Per-beam alerts (e.g. cuts exceeding max stock, zero kerf, near-duplicate lengths). These also appear as small badges on the collapsed header.
The toolbar at the top provides:
- Run Alkali Nesting — Runs the optimization and generates a PDF cutting plan with color-coded bar diagrams.
- + Scenario — Clone the current scenario. Each tab has independent stock and pricing. Double-click a tab to rename it.
- Clear All — Resets all scenarios and data.
Nesting Output
The optimizer produces:
- PDF cutting plan — Color-coded bar diagrams showing each cut, kerf marker, end trim, and drop-off waste on every stock bar, plus a summary table.
Stock Config
A stock config tells the optimizer what bar lengths are available, what they cost, and any per-beam kerf or trim overrides. Each scenario has its own stock config, so you can compare different suppliers or inventories.
The stock config bar appears above the beam rows with two buttons:
- Download Template — Get a pre-filled CSV with one row per beam type. Columns: Beam Type, Stock Length, $/ft, $/stick, Kerf, End Trim, Limit.
- Upload Stock Config — Drag and drop or browse to upload the completed CSV or Excel file. The config replaces default stock lengths, pricing, kerf, and trim for that scenario.
Scenario Comparison
Compare different stock selections or pricing side-by-side:
- + Scenario — Clone the active scenario. Upload a different stock config to each one.
- Compare — Automatically runs nesting on every scenario, then ranks them by cost (cheapest first) with waste percentage, bar counts by length, and a detailed cost breakdown table.
- What-if testing — Answer questions like "What if I only have 40 ft bars?" or "Is it cheaper to buy 20 ft or 24 ft stock?" by running each scenario independently.
Revisions
Revisions
Compare an updated drawing set against an original project, review the differences, and create a clean merged PDF with only the changes you accept.
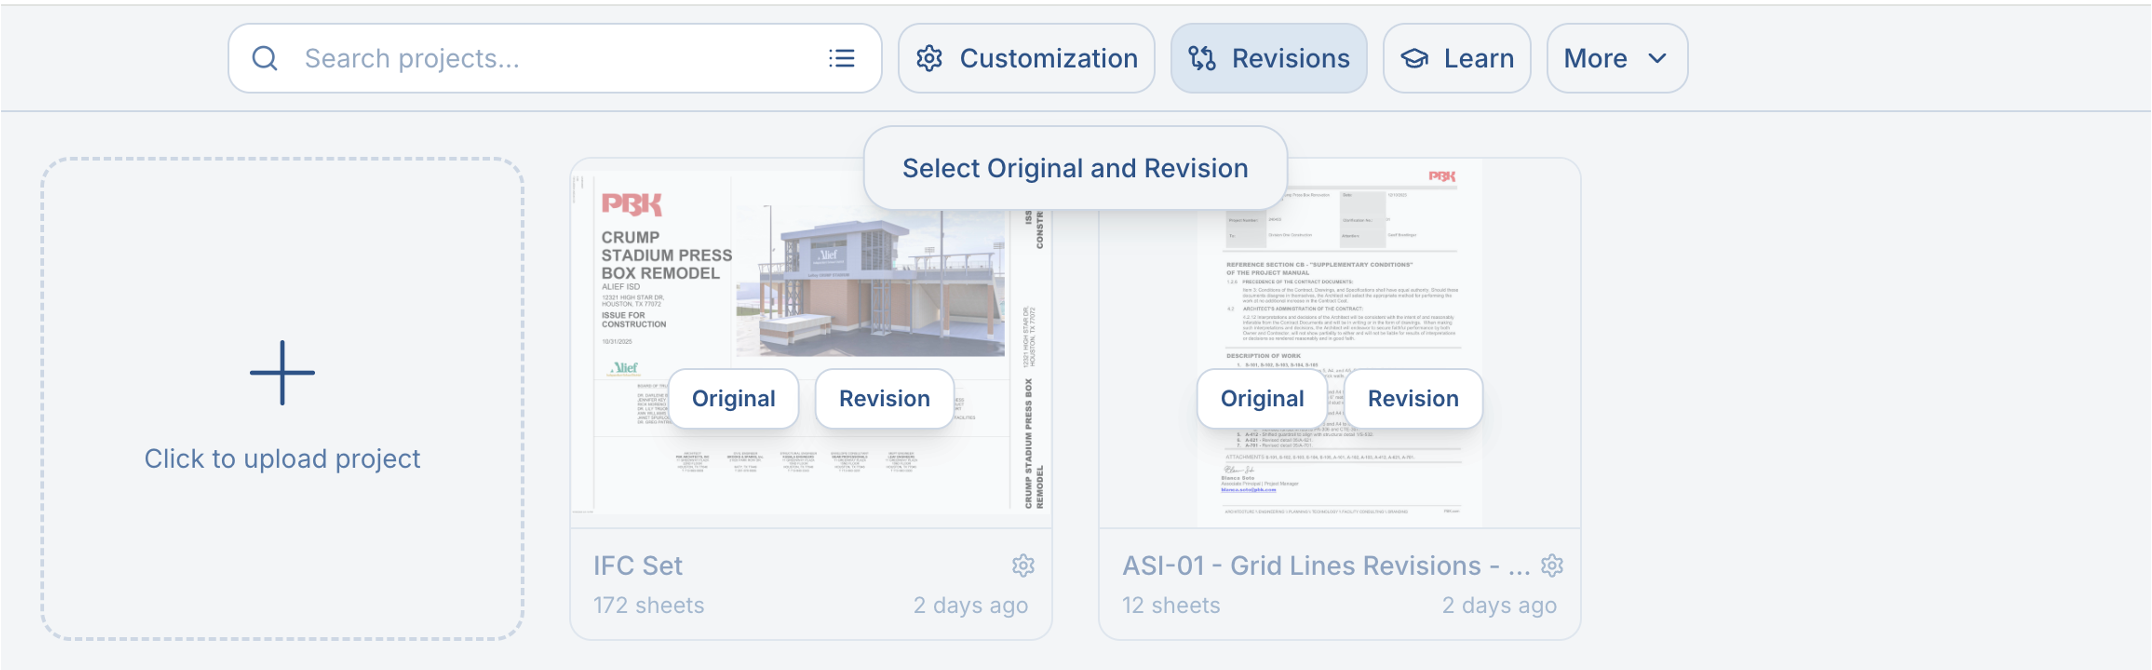
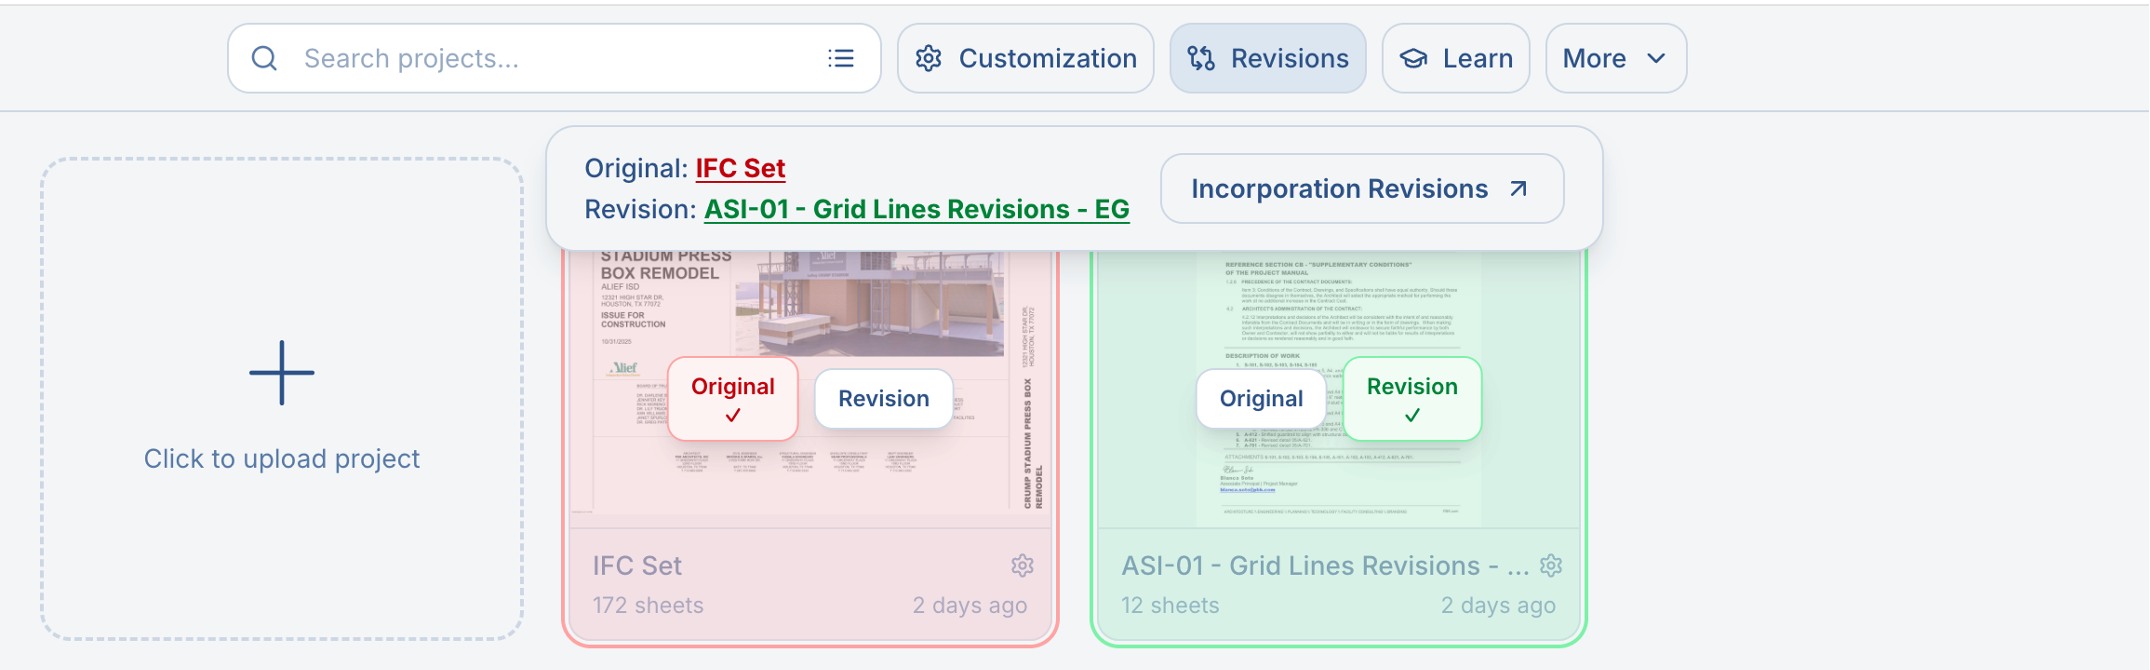
Create a Revision
From the home page, navigate to the folder containing both the original file and its revision. Click Revisions, mark one project as the Original, mark the updated set as the Revision, then start Incorporation Revisions. Alkali creates a Revision card so you can leave and come back while review is in progress.
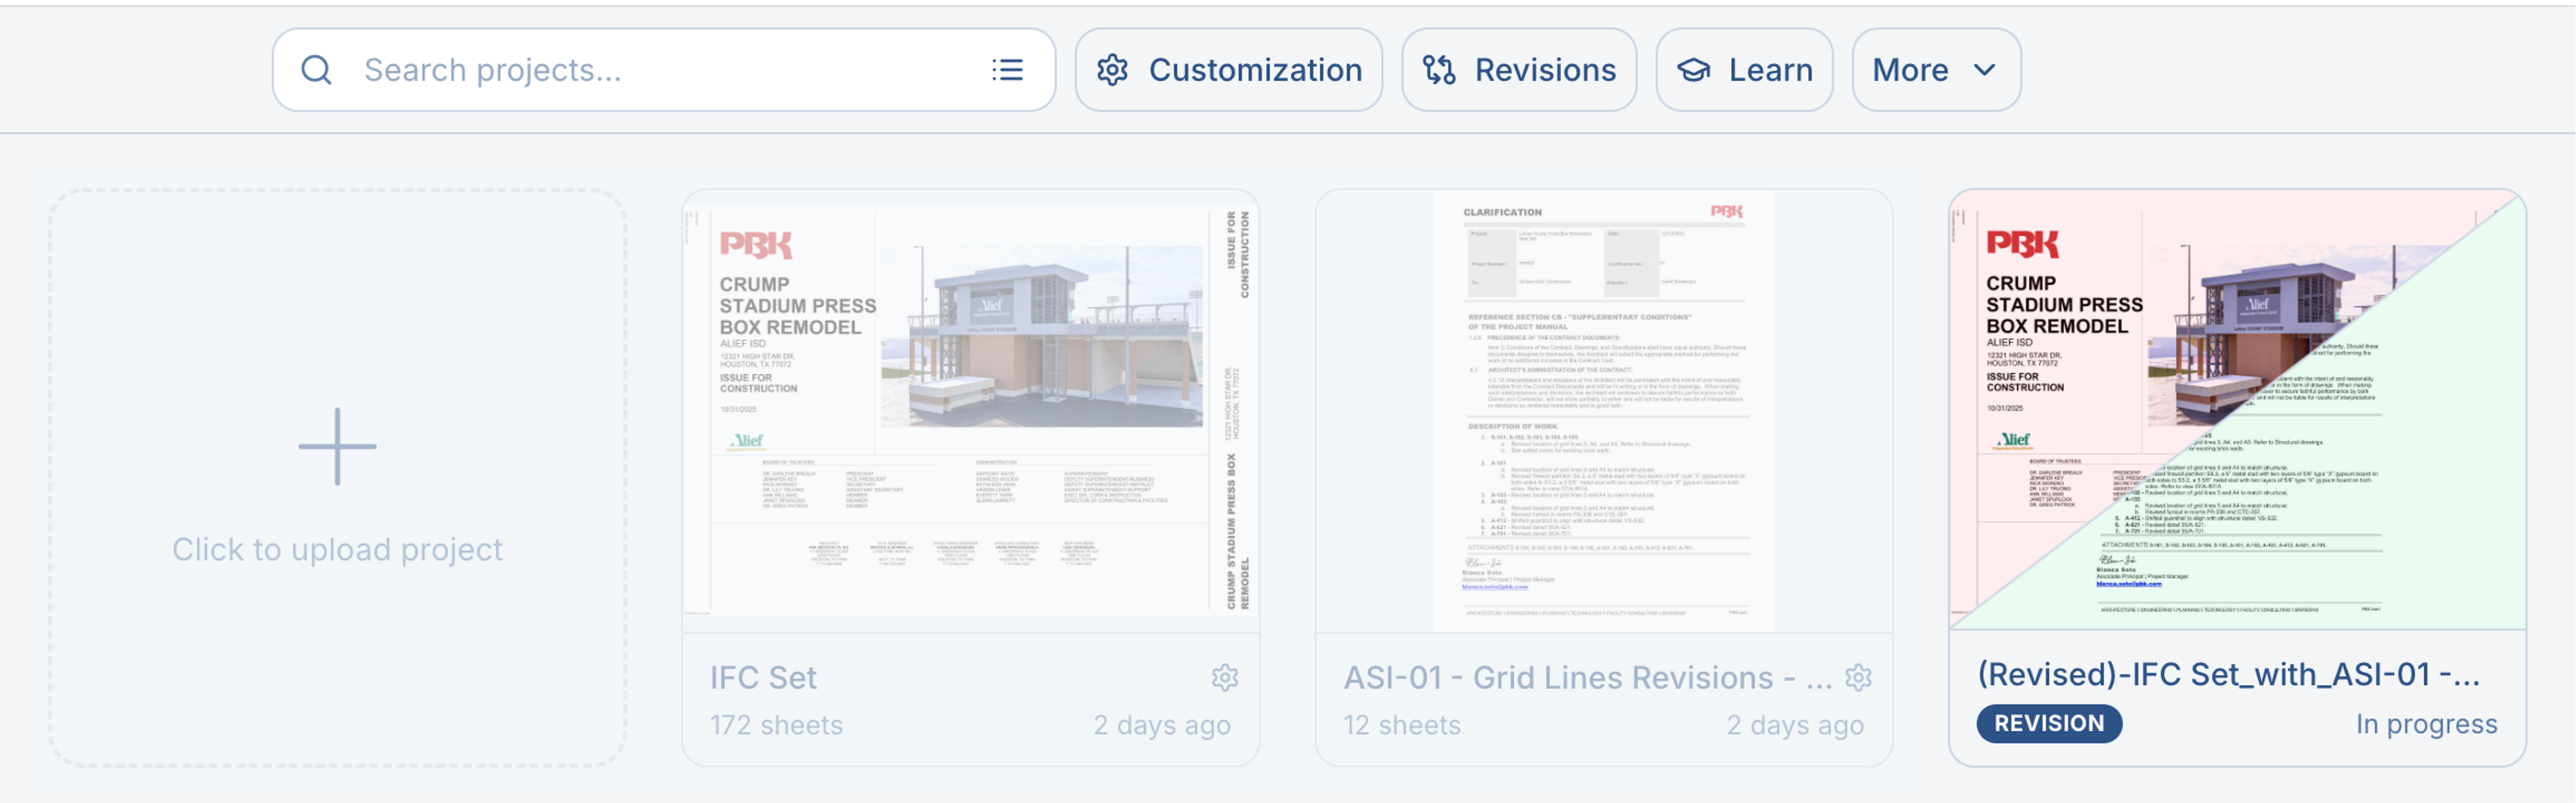
Review Changes
Alkali matches the pages, compares the takeoff annotations, and highlights added, removed, and edited members. Use Merged, Side-by-side, Superimpose, and Diff views to understand what changed on the drawing before accepting it.
Check out the video tutorial to learn how to incorporate addenda and revisions.
Estimodeling
3D EstimodelBeta / Pilot
3D Estimodeling turns your marked-up steel takeoff into a lightweight model you can inspect from the project. It is available to subscribers as a pilot feature.
Open the Model
From a project, click Export then 3D Estimodel. The preview updates from the current project annotations, so each project opens its own model.
What Feeds the Model
- Beams, columns, braces, base plates, and panels come from your takeoff annotations.
- Scale calibration controls member lengths and overall proportions.
- Page elevations and height maps place framing plans at the correct vertical levels.
Collaboration
Project Sharing
Invite team members, or make a project public.
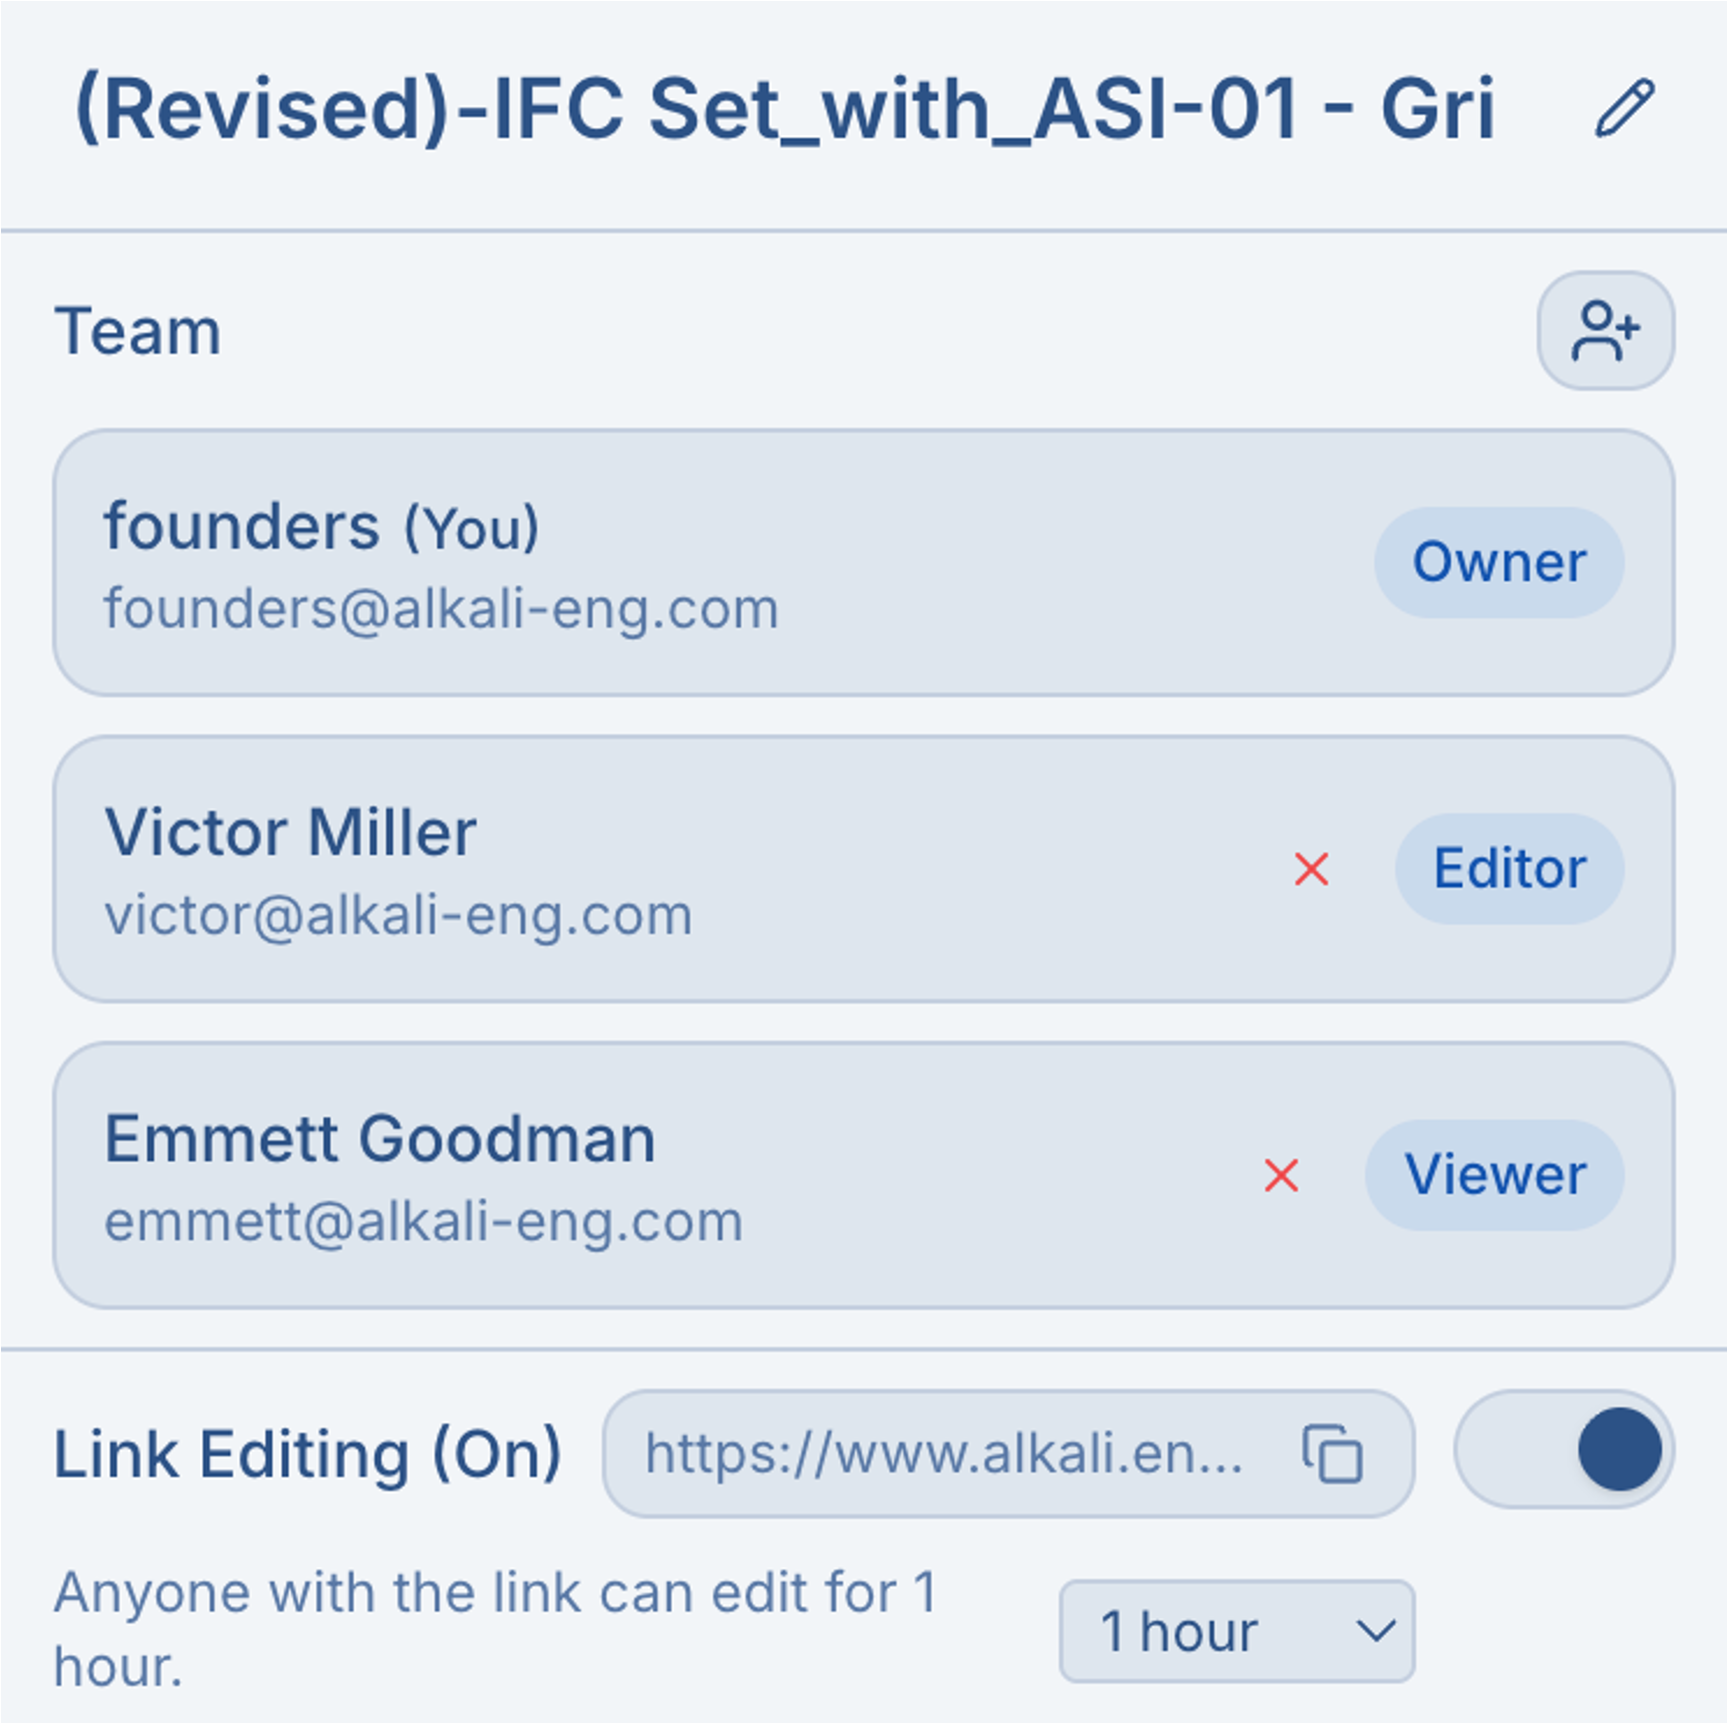
Sharing Methods
- Email Invites: Invite specific users by email address. The project will automatically appear in their account.
- Share Link: Generate a shareable link for quick access. Anyone with the link can view the project.
Roles
| Role Name | Description & Capabilities |
|---|---|
| Owner | The person who originally uploaded the project. Owners are the only ones that can add people to the project, and delete the project. They also can do all editing on the PDF, i.e. the editor role. |
| Editor | Editors can add and update markups, measurements, material data, and notes. They can't delete the project or add collaborators. |
| Viewer | Viewers can only open the project and review drawings without changing project data. |
Real-time Collaboration
On a single PDF workspace, collaborate in real-time with your team. Alkali synchronizes changes instantly so everyone sees them.
Live Cursors
See where your teammates are working in real-time. Each collaborator has a unique color, and their name appears next to their cursor as they navigate the drawing.
Instant Sync
All annotations, measurements, and notes sync instantly across all connected users. When a teammate adds or modifies an annotation, you'll see it appear immediately without refreshing. Material catalog and tonnage calculations also sync in real-time.
Company Page
The Company Page gives your team a high-level view of Alkali usage across the company. It tracks uploaded projects, total tonnage analyzed, and performance trends over time.
- Projects Uploaded: Total PDFs uploaded by your team.
- Tonnage Analyzed: Total steel tonnage analyzed across a subset of uploaded projects.
- Performance: A quantitative metric most similar to an F1 score, calculated on your own data. It often increases over the first few months as the system adapts to unique patterns in your architects' drawings.